Duarte Leão, our CCC master chief, sent last friday an email to the crew at webdetails to share some very interesting information about some recent goodies in CCC charts.
Unfortunately, he wrote it in Portuguese... (one out of the many things that actually drive me crazy). In between punches, where he promised he wouldn't do it again, he volunteered to translate it. But since it's not like you people pay me for blogging (well, some of you do, indirectly, but meh), google translate is good enough :)
Enjoy, and thanks Duarte!
![http://www.webdetails.pt/ctools/ccc.html#type=bar&anchor=bar-with-5-number-statistics]()
Unfortunately, he wrote it in Portuguese... (one out of the many things that actually drive me crazy). In between punches, where he promised he wouldn't do it again, he volunteered to translate it. But since it's not like you people pay me for blogging (well, some of you do, indirectly, but meh), google translate is good enough :)
Enjoy, and thanks Duarte!

Hellocolleagues!TLDR
talks aboutnew features inCCCthat can helpusto get homeon timemore often
readonly theheaders
jump directly tothe sections☛
orclick alinkin anothersample
saveforlaterif you needOverlayplotsof arbitrarybutconsistent[CDF-287]
There is muchthat theCCChas the conceptof a secondplot.
Best known forPlot2, this is a graphof points(lines, area, points) that can besuperimposed on themainplot.
The graphicsthat supportthe secondplotisa bar chart, the lines, the scatter(line metric) andbox plot.
Data from the secondplotisa partitionof the data table- the rowsthat have theseriesgiven byplot2Seriesorplot2SeriesIndexes. The remainingseriesare presentedin the mainplot.
Whatever thepartitionin any of theplots,the data columnhad tobe the same.WhatwasconfigurablebyvalueRoleproperty, whichwould containthe name of thedata column("dimension"indialectCCC).
Latercamethe functionality ofregression calculationdata, and with it thetrendplot.
The regression isenabledindividually foreachplotofthe data(notthe actualtrendplot) using trendType(orplot2TrendType) option.
The data linesgeneratedby the regressionalgorithmare added to theoriginal table, but a differentpartition.
It isthis partitionthat feedsthe thirdplot, the trendplot.
For each set ofdata from aplotthat has theregressionenabledpartitionis generateda corresponding seriesregression, thespecial partition"trend".
The onlyseriestrendplotshows theregressionof all the otherplots.
The waythat CCCusesto representpartitionsin the data tableisthrough a specialcolumn thatby defaultis calleddataPart.
Till datethe plotsconsumedata from the followingpartitions:
partition"0"mainplot➜
partition"1"➜secondplot
partition"trend"➜trendplot
Thiscookedbetweenplotsand datapartitionswasfixed.
Whatplot2Seriesandplot2SeriesIndexesoptionscauseis fill in thefixed values"0"or "1" on dataPartcolumn, depending onthe value of thenumber ofeach line.
However, it was possible to assignthe value"0"or "1"usinganyotherlogic, notbased ontheseriesof such options(using readers, calculationsorvisualroledataPartbindingtoa columnpre-chargedwithspecial) values.
It canherebe drawnthat the secondand thirdplotare supported ongraphs withCartesian axes(X, Y). TherePlot2for thepiechart, for example.
But theappetite for moreand moreoverlappingplotscombinationshas "nolimits":
Menulines, points andareas, asa shared
partition1➜plotlines
➜partition2plotlines/points(with other colors /styles)
partition3➜plotareas
Menubarsandlineswitha measurewith anothermeasure(measuredin the samerow of data, without resorting totrickslike usingthe seriesto distinguish)
partitionandmeasure 11➜barplot
partition1 andmeasure 2➜plotlines
Menubarsanderror lines, with threemeasures(ditto)
partitionandmeasure 11➜barplot
partition1 andmeasures2:03➜plotboxes, onlyindicatingthe minimumand maximum
Menuconcentricpies, category and sharedmeasurement (a kind of piefor twoseriesand sharedcategories)
partition1➜plotpies
➜partition2plotpies
Menubarsandbars, overlaid with twomeasures(ditto, a bar maybe the presentandthe otherthe target valuevalue)
partitionandmeasure 11➜barplot
partition1 andmeasure 2➜plotbar(withsemi-transparent color)
Andmost relevantoverlapsarise, there weremore types ofplot; I'mimaginingthegantt, toplotgrid lines, plots for notes, whatever.
☛To supportthese scenariosisthereforea question of powerset, ina chartoptions:
a list ofarbitrary typesofplots, butcompatible, theoverlapping
plotusesaparticulardata partition
thevalueof a plotmust represent adata column,"vendasActuais,"for example, andthevalueof anotherplottorepresentanother column ofdata"vendasObjectivo" for example;
shallbegin to soundthe words"visualrolesforplot"
This is whatisalready possibletodaydo.A funnyexample. A Christmas tree. The concentricpies.Number formatting, internationalization(ori17o) [ANALYZER-2391]
Formattingdatesand readingtheCCChas beenprovided byProtovis, relatively easily, viamasksformatting, like this"% Y-% m-% d"(pv.Format.date). However, you have to settle forformatted datescontainingthe names of thedaysof the week orthe monthsin English.Thisremains thecase, despite what is describedhere. Something thatis on the list.
People oftenturn tolibrariesof thirdformatting, such asmoment.js, an authenticSwiss Army knifefor dates, whenever somethingmore"serious"isnecessary.MikeBostockhadotherdelegatethe implementationof a featurecrucialfor buildingviewsandd3.jswould not havetheir own APIfor formattingdates, numbers, etc.. The reasonsonly heknowsthefor sure.I thinkthere are greatadvantagesin distributing, in one file, andwith a uniformAPI, all that isnecessary,essential, to buildviews(...).
With regardto formatand readnumbers,Protovishasa similarclass,pv.Format.number, not,however,support anysyntaxformatting mask. As withdates, oftenwe resortto third partylibrariesto format numbersdifferentlythan the default,orthroughValueFormatpercentValueFormatfunctions.
Withthe new graphicSunburst, added to theAnalyzer, which hastotalvaluesat various levels ofa hierarchy, the needto be able toformat numbersin the same waythat theAnalyzerdoes,on the server, viaMondrianemerged. Thisformatusesmaskslikethose we seein Excel, something like"#, 0. # #".
Adding tothis needthe aforementionedlack ofa way toformat numbersviamasksformatting, the path chosenwas to implementan APIin JavaScriptto format numbersaccording to thesemasks.
Ratherthaninitially thought, notthesemasks toMondriandata sourcesinCDA, something thatwould ensurefamiliarity withthe syntaxof the maskswhousuallydevelopsdashboardswithCToolsare used. Nothing you cannot do,pass theCDAcanreturn datato the original valuesaccompaniedtheformatted value(require at leastgeneralize theJSONoutput format).
Something thatis importantin this field, to be able tosatisfyeitherthe Greeksorthe Trojans, isable to configurethe formattingof valuesat various levels: dashboard /global,per chartforthe data column.
☛This is possibletoday:
Globally(using fluentinterface)
cdo.format.defaults
.number ("#, 0.00")
.percent("#, 0:00%")
.date ("% Y /% m/% d")
(cdo =CommunityData Objects, a spin-off ofthe oldnamespaceclasses, pvc.data)
graphic level
pvc.BarChartnew({
....
format:{
number"#, 0.00",
percent: ....
}
});
dimensionlevel
pvc.BarChartnew({
dimensions: {
sales: {
format:"#, 0.00"
}
}
});
Havingmefocusedin shades, ispossible, however,in anyof the levels, andusingJSONAPIorconfigure theformattingstyletomeet the needsofi17o:
pvc.BarChartnew({
....
format:{
number:{
mask:"#, 0.00",
style:{
decimal","
group, "."
NegativeSign: "-",
currency: "€"
//(...)
}
}
}
});
Shadesformatsupport:
multiple sections: positive values, negative, zero, and zero
percentages
roundingwithouterrors, asintroduced byNumber#toFixedmethod
mixture ofany content on themedium,before orafter the numbers
divide bya thousand, million, ...
monetary values
scientific format
In addition to theoptionsof theCCCdocumentation(a good start is here), there is athird-party pagehere. The mostcomprehensive documentationisevenreflected in theunit testfile.
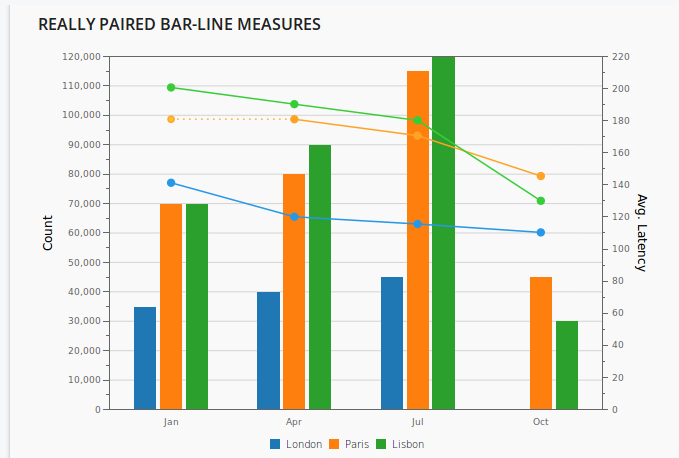
Turningto the functionalityof theoverlayplots, it is now possible toformat it differentlymultipledimensionsof measurement.
Seethe differencein the presentationof the measuresin thetooltipbetween(i) the only possibleapproachbefore:pairedbarlinemeasuresand(ii) can now: really pairedbarlinemeasures.
Note alsothedifferent experienceyou have withthe legend.
One last note. TheValueFormatoptionpassedto applyto any columnofnumericdata, whatever its name. So faronlyapplied tocolumns namedvalue, value2, value3, etc..Tooltipmore informative, more stylable [FDC-282] [FDC-287] [FDC-306]
☛The newtooltipClassNameoptionallows you to specifyan additionalCSS classfor thetooltipof a graph; examplereallypairedmeasurelinebar.
The defaultcontents of the newtooltip(called summarydata):
isa table(goodbye spaghettilinesof names andvalues)
gives more information:
whichvisualrolethat acolumn of datais playing? Specialcharacterslike↕, and∠⊞indicatethe visualscrollbeside the name ofeach column of datato(there are still many basicvisualcharacterroleswaiting)
what type ofinterpolationnullforeach measureseparately
showsvaluesresultingaggregation(number#andsumΣ⋃orlist)
can adaptyour styleto theplot, axis, legendto whichthe information pertains
makes itpossible to hide/change someof its parts, without the need towrite anyroot
Tipsy.cssThefile containsinformationabout the structure ofthe variousHTML andCSS classes.
In the example, alsonotethetooltipthat appears whenyou hover themouse over thelabelsof the axisofX.Pointing[CDF-306]
☛The new optionsallow you to configurepointingandpointingModeand choose fromthetraditionalmode, pointingover, and a newmode, thenear(the new default value.)
Thenearmodewill activatevisual elements thatareclose to thepointer, whether they areon topof or belowother.
Thepointingaffectsboth thevisualdetectionof the activeelement, suchas theoptionhoverableunderstandsboththe presentation of thetooltip.
Additionally, clickingsomewhere, when avisual elementis active, it is always as ifyou click theactive element, whether or notthis isthe first elementunder thepointer.
Thenearmodemakes it possible tointeract withvisual elements that, overtheway,are inaccessibleto the user,due to the overlappingof variousplots, theexistence of overlappingserieswithsemi-transparent, etc.funds.
Additionally, overthe waymakes it very difficult(and is a good exercisecontrolaggression) interaction withvisual elementswithout innerarea (oralmost no), as are thelines.
Theovermode can be usedeither bychoiceeither tomaintain fullcompatibility with previoususes,mainlyfor cases wherealready apointbehaviorwastheProtovisto be used.Value Labels[ANALYZER-1545]
☛Thepurposeof this story, it created anewvaluesOverflowoption, withpossible valueshide, trimand show.TheexistingvaluesOptimizeLegibilityoption was implementedin moretypes ofplots.
Examplethat usesboth options: stackedhorizontalbar.

BlurringtheExtension Points
Theextension pointsare points ofmore orless directinputtoProtovisworld-the worldthat supports theCCC.
The existence of thesepointsmakeCCCa library ofextremely flexiblegraphics.
Essentially, some objectsused by theCCCProtovisare exposedfor furtherconfigurationby means of ahandle.
Joining thisidentifierthe name ofa property ofProtovisobject (or the name of one of itsspecial methods), you can configurethe object, and evenadd newobjects, next to that. The identifier of theobject andthe propertyare separated by"_".
For example:
"plot2Label_textStyle"⬌"textstyle"property of theobjectProtovis"plot2Label"(⬌ object "label"theplot "Plot2")
In the definitionof aCCCchart, theextension pointsare placedin a dictionary thatis placedin the "extensionPoints"option:
pvc.BarChartnew({
Plot2: true,
//...
extensionPoints: {
plot2Label_textStyle: "blue"
}
});
From the momentin which it ispossible to addanarbitrarygraphicplots,it is necessary tobe able to receiveitsextensionpoints... Forthis reason,therehavenotguaranteecollision with theprefixesmanyexistingoptions.
Although it waspossible to devise aschemethatwould allowprefixes, we opted for thesolution, which in someperspective, it is simpler: the options andextensionpointsof the newplotscannot beplaced nexttothe other, viaa single prefix. Oncethe existence ofmultiple plotsin itselfisan advanced feature, and that, even ifnotso defined, the CDEwould have no wayofgetting theseoptions(do not know the plotsthat the userwill definebeforehand...) we chose toonly allowspecification of theiroptionsforcode andwith thedefinition of theplot (not withinthetopoptions, thechart):
pvc.BarChartnew({
plots: [
{
type:"point",
valuesVisible: true,
//...
extensionPoints: {
label_textStyle: "blue"
}
}
]
});
Thus, noprefixes toinvent andalsomoves towardsa hierarchicaldefinitionCCCwithoutprefixesin the namesof the properties(something that a futureeditor alsobearwillingly).
But itdoes not end here.
One of the reasonswhy "not appreciate"the(s) Property(s) extensionPointsisobligeto formtwo sets of propertiesof a graph: the options andextensionpoints. Within each ofthe propertiesare organizedagainby sub-components of the graph:properties of theX axislegendproperties.Thisrepresentsan obstacletothe modularityof the definitions. When I copythe properties for theXaxis, Icopybothoptionsasextension points. I have togo to twosites, copy,and then putin two places...
The other reasonis the divisionrequirespecialtreatmentwhen writingcode inpreandpostexecutionfetchcomponents. Thedictionaryextensionpointsmustbe converted toCDFformat (an array of arrays withkey and value) for theCCCformat (a dictionary), changedtheextensionpointsthat format,thenconvertedtoCDFformat.
LatertheCDFcomponent itselfmust convertthe setagainfor theCCCformatwhenbuildingtheCCCchart.
To make matters worse, there isoftenthedashboardsofextension pointsthatare intheextensionpointsandCDFcode thatis inCCCformatcode form, making it more difficulttocopy & pastea fewsitesfor others...
Then thereto explainthisover and overin the forums.
Are obstaclesthat do not addenoughvalueandnmhoonly increasethe learning curve.
☛The currentversion ofCCCallowsextension pointsare placednext to the options:
pvc.BarChartnew({
plots: [
{
type:"point",
valuesVisible: true,
label_textStyle: "blue"
//...
}
]
});
Aimportantdistinction betweenoptionandextension pointisby the existenceof the"_" characterin the property name, which is never used intheCCCoptions.
Examplesof theCCCsitewere allreviewed in orderto group thepropertiesby sub-component of the graph, facilitating the understanding anddefinitionsofmodularity.
Reasonablyrepresentativeexample: statisticswithnumber5bar.
I think I willnot havemissed theDashboards.propertiesArrayToObjectandDashboards.objectToPropertiesArrayfunctions.
☛Another new featurein the areaofextension pointsisthe special methodcall.
Askingtoborrowthe languaged3, the callmethodto runProtovisallowsarbitrarycodeon anysubjectProtovis:
pvc.BarChartnew({
plot_call: function () {
this.anchor('center')
.add (pv.Label)
.text("Hello");
}
});
Unlike whathappensin allother properties/methods(exceptadd), thisis theProtovistheobject itself.
This languageispreferable tousetheadd methodor writingcodebyoptionrenderCallbackchart.
other
Legendstopped allowinghidethe last visiblenumber.
Thelogof abstracts"data source", "date", "complex type"and"visualroles"ismuch morereadable.
Newhelperfunctionpvc.finishedto facilitatemakingthe value of anendpoint ofextension.
Thesummary ofproperties andextension points intheCCCsitedid not includepropertiesof complexvalue, asreaders, dimensions, calculations, plots ...
New methodsof the graph, to replacerenderingcalls (boolean, boolean, boolean??)
renderInteractive() tore-renders onlyrefreshesyour style,chasingpointsextensção
renderResize(width, height) to re-rendersresize
Separationof thecorecodeand plugins, one for eachtype ofgraph;justtohavesomethinginternal.
Moved fromthepvc.datanamespacecodefora newCTool, cdo(acronym forCommunityData Objects).
[CDF-276] NewdataWhereoption, allows you to filterdata rowsusingobjectscdo.Datum, nowindependentof the concreteformof transportCDA.
Andhopefully,correctingmore errors thanthe input.
best regards,